A supertanker needs miles to change course. You see the bow start to swing long before the hull follows. The dollar is that kind of ship: one inflation print is a wave, not a turn. What turns it is many signals changing at once. On 30 September the ship arrived at the most important level on its chart, and several of those lights began to flicker.
The dollar index closed the week of 2 October at 101.93, above the 101.35 head that this map named as its line in the sand. By the map’s own rule, the reading of 30 September is cancelled: the ship did not turn at the lid. It closed the week higher even as the lights below moved against it: Fed hike odds fell from 70% to 15%, payrolls rose by only 29,000, and euro-area inflation came in hot.
But it stopped right under a bigger line. The 50% retracement of the whole 2021–22 rally, from 89.3 to 114.8, sits at 102.0: the midpoint of five years of dollar history, between the 38.2% and 61.8% levels that framed the 2023–24 range. Two paths from here. A weekly close above 102 ends the range regime, with the flat edge of the cloud near 103 and the 38.2% level near 105.0 as the next magnets. A rejection at 102 and a fall back below 101.0 would make this week a false break: the box would still stand, and point six would come back into view. CPI on 14 October, the cloud twist in the week of 26 October, the Fed on 27–28 October and the midterms on 3 November decide which.
The line that keeps coming back
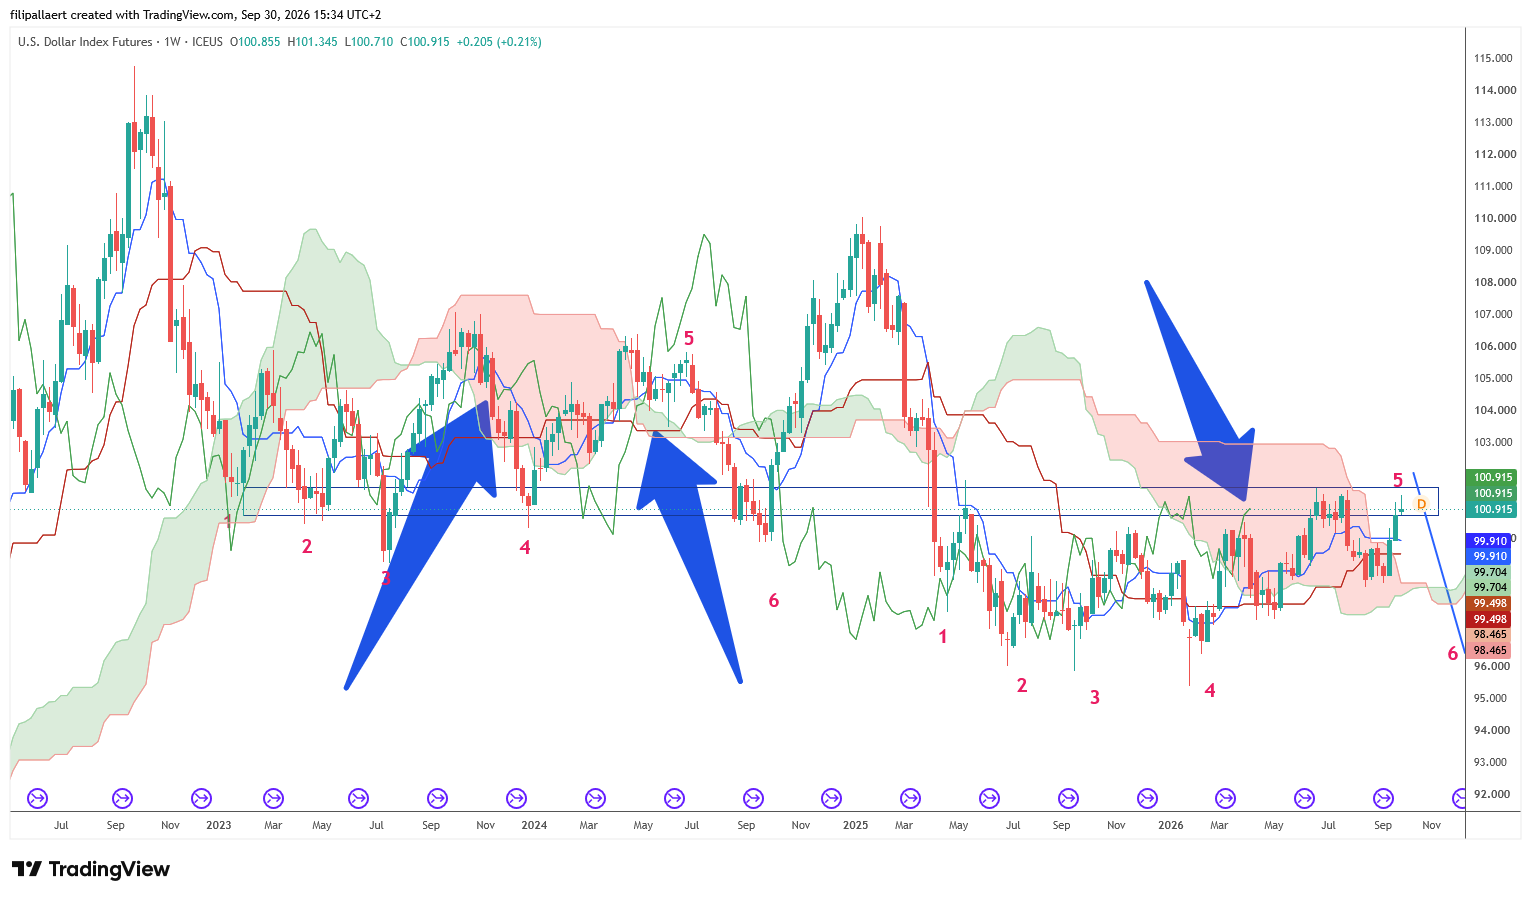
On a weekly chart of the dollar index, one horizontal zone runs from 2023 to today: roughly 100 to 101. In the 2023–24 range it was the floor. The dollar bounced off it in the spring and summer of 2023, again in December 2023, and a last time in September 2024, a month before the presidential election. From there it rallied to 110.
In 2025 the floor broke, and the dollar has since spent eighteen months in a box between about 96 and 101. The old floor became the lid: the highs of June and July 2026 stopped there, and on 30 September the dollar was back against it at 100.9. A level that was support three times and has now been resistance twice is what traders call a polarity zone. The longer a level has mattered, the harder its flip tends to hold.
The bigger map
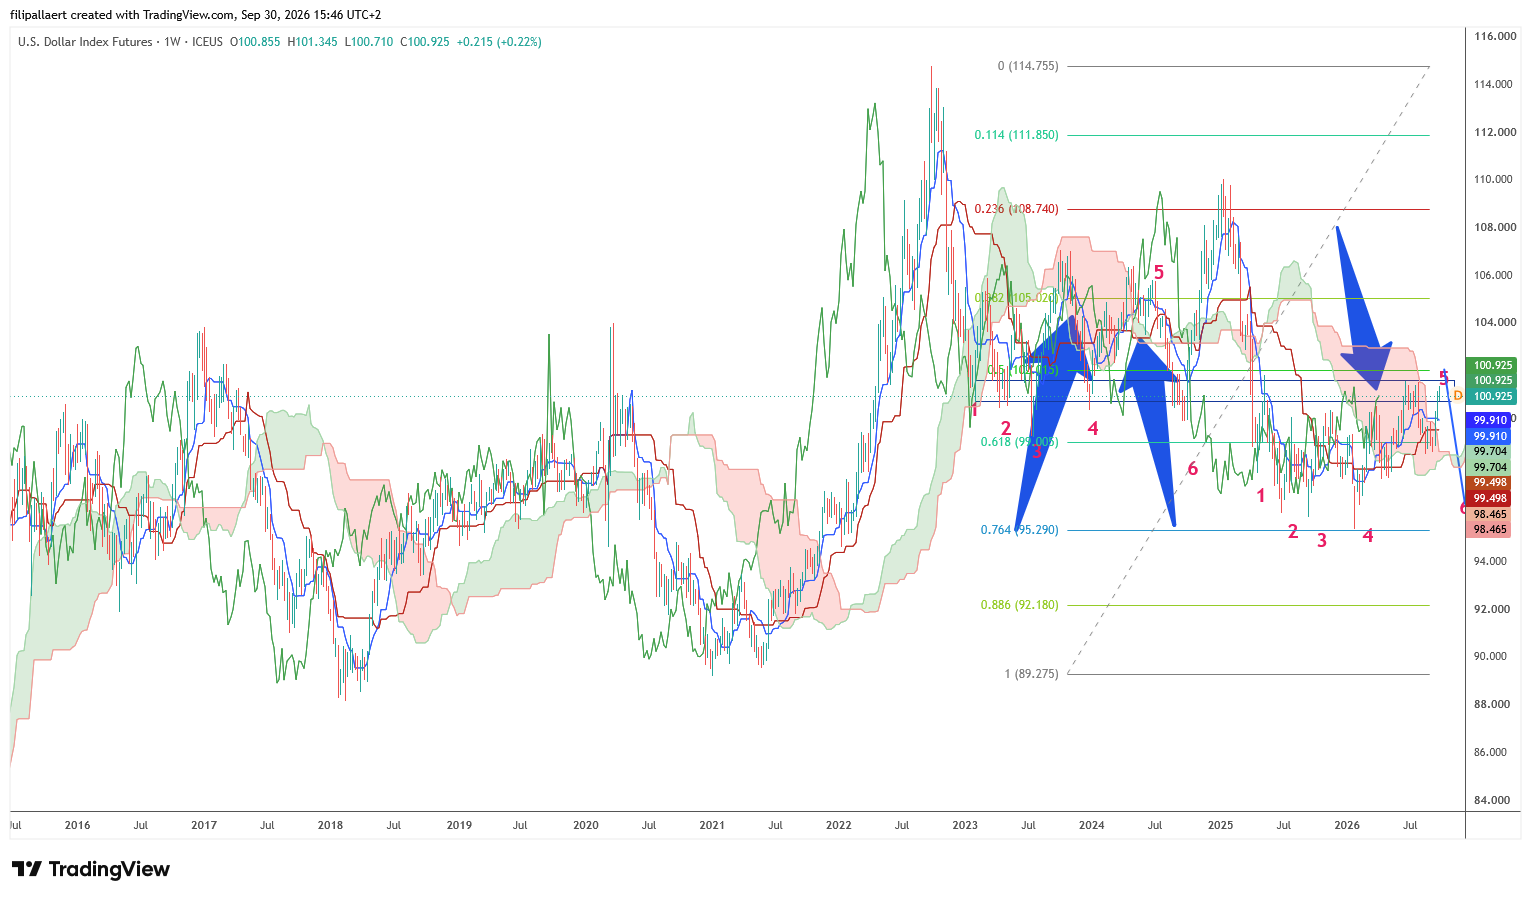
Zoom out further and the two ranges sit inside one larger structure. Measure the dollar’s rally from its 2021 low near 89.3 to its 2022 high near 114.8, and the Fibonacci retracements of that move frame both boxes. The 2023–24 range traded between the 38.2% level (about 105.0) and the 61.8% level (about 99.0). Halfway between them, the 50% level near 102.0 is the midpoint of the whole move. Since 2025 the box has sat one floor lower, between 61.8% and 76.4% (about 95.3), where the lows of 2025 and early 2026 stopped.
That puts the 61.8% retracement near 99.0 on the higher timeframe right next to the weekly Kijun at 99.5 and the bottom of the weekly cloud at 98.5. Three measures from three methods, one zone. If the lid holds, that is the first real floor the dollar has to deal with on the way to point six. Below it, trendline support near 97 and the 76.4% level at 95.3 bracket the zone where point six would have to form.
Momentum tells the same story. The weekly RSI stood at 58 on 30 September: not overbought, but since the 2025 drop it has not closed above about 62. A ceiling in the low 60s is typical of a range, and it sits at the same place as the price lid. There is one warning in it: the RSI lows have risen since mid-2025 while price lows held roughly flat, a mild bullish divergence. It fits the idea that point six could be the last low before a turn up. An RSI push above 65 with price above 101.35 would mean the range regime is over.
Six points in a box
The two ranges look alike when you number their swings. In 2023–24 the dollar printed four swing points inside the range, then a fifth at the top, around 106 in June 2024. Point six was the final low, near 100.2 in September 2024: a drop of about 5.5% in some twelve weeks. Then the range broke and the dollar ran.
In the 2025–26 box, points one to four are in: April 2025, July 2025, September 2025 and the wick of January and February 2026 near 95.5. Point five, on this reading, is being printed now at the lid. Point six would sit near 96, the bottom of the box, about 5% lower. If the rhythm of 2024 repeats, that takes until somewhere between November and the end of the year.
That is the author’s reading, built on range trading and Ichimoku: tracking where the lagging span and the cloud edges run into price, reading the same pattern on several timeframes, and using the future cloud as a clock. It is a map, not a prophecy. The data sections below are there to test it.
The same pattern, one day wide
Fractals show the same shape at different scales, and 30 September delivered a small one. On the 15-minute dollar chart a head and shoulders had formed over two days: shoulders near 101.1 and 101.2, a head at 101.35 on the evening of 29 September. The soft US core PCE print at 14:30 Brussels time broke its neckline. The bounce that followed came back to kiss the old neckline from below and was rejected. A wider head and shoulders, with its left shoulder on 24 September, still has its neckline near 100.6–100.7 to break; its measured target lands near 99.9, right on the weekly Tenkan line.
| Level | What it is |
|---|---|
| 102.0 | 50% retracement of the 2021–22 rally. Update, 4 Oct: the line that matters now; a weekly close above it ends the range regime. |
| 101.35 | Head of the pattern. A weekly close above it cancels this whole map. Update, 4 Oct: broken, weekly close 101.93 on 2 October. |
| 101.0–101.1 | The kiss: old neckline and the lid of the weekly box. |
| 100.6–100.7 | Neckline of the wider pattern, lows of 25 and 29 September. |
| 99.9 / 99.5 | Weekly Tenkan and Kijun lines. |
| 99.0 | 61.8% retracement of the 2021–22 rally. |
| 98.5 | Bottom of the weekly cloud. |
| ~97 | Long-term trendline support on the author’s chart. |
| ~96 / 95.3 | Bottom of the box, projected point six; 76.4% retracement. |
The lights that have to turn
A chart can say where. It cannot make the ship turn. These are the lights on the bridge, as they stood on 30 September and updated on 4 October.
US inflation
Core PCE rose 0.2% in August against 0.3% expected. The Fed’s own gauge came in soft on the same day the statistics agency revised its methods.
Europe running hot
France, Germany, Italy and Spain all printed above forecast, between 3.0% and 4.9%. The euro is the largest weight in the dollar index, and a pressured ECB lifts it. Update, 2 Oct: the euro-area flash came in at 3.8% against 3.6% expected, core 2.5%.
The Fed
Odds of an October hike fell from about 70% to about 45% after New York Fed president Williams spoke. A pause turns this light green; a hike keeps the ship on course. Update, 4 Oct: the odds fell to 28% by Friday morning and to 15% after the weak jobs report. A pause is now the base case, so this light has turned green.
Yields
The 10-year closed at 5.24% and the 30-year at 5.56% on 28 September, the highest in our data since 2019 and up from 3.97% and 4.64% on 27 February, the day before the Iran operations began. High yields pull money into dollars. A top here, which the soft PCE hints at, would switch this light.
US growth
The Atlanta Fed’s GDPNow model put third-quarter growth at an annualised 5.0% on 25 September, second-quarter growth was revised up to 2.2%, and the Chicago business barometer jumped to 58.8 in September against 51.0 expected. An economy running this hot gives the Fed no reason to cut and gives capital a reason to stay in dollars. Update, 4 Oct: September payrolls rose by only 29,000 against 90,000 expected, unemployment rose to 4.2% and wages by just 0.1%. Output still runs hot, jobs do not: this light moves to amber.
The Treasury
Treasury Secretary Bessent doubled buybacks of 10- to 30-year bonds to at least $4 billion per operation from 9 September, and funding more from the Treasury’s nearly $1 trillion cash account has been discussed. Pushing long yields down is a weak-dollar policy by another name.
Diesel and oil
Diesel margins stay near records and push headline inflation up everywhere, which keeps central banks hawkish. On 30 September Russia extended its ban on diesel exports by producers to the end of October, tightening the market further. As long as diesel is expensive, this light stays red. See the crack spreads indicator.
War
The Strait of Hormuz has been closed since 28 February, and a tanker was hit by a projectile this week. In a crisis money runs to the dollar first. Escalation keeps the ship on course; talks would turn this light.
Europe’s own risks
France pays a record 413 basis points more than Switzerland to borrow for ten years. In June 2024 a French political shock sank the euro and lifted the dollar. The same could happen again.
Foreign demand for US debt
On paper it holds up. In practice a growing share comes from hedge funds registered in the Cayman Islands, which the statistics count as foreign: their Treasury bill holdings jumped to a record of about $210 billion by July 2026, the fastest rise on record (Bloomberg). That is leveraged money buying short-dated bills, not governments buying long bonds. Japan, the largest foreign holder with about $1.1 trillion, is fighting its own battle: its 10-year yield hit a 30-year high this month, and Asia Times reports the first coordinated US–Japan yen intervention since 1998. Defending the yen means selling dollars. The long end is where the buyers are missing.
The shadow story
Claims that the yuan is becoming gold-backed, and a slow drift of trade away from Western payment rails since the 2022 sanctions. Parts are true: China’s central bank has added gold for 22 months running and the Shanghai Gold Exchange runs a vault in Hong Kong. Official gold convertibility of the yuan is not confirmed. This light only counts once China confirms it, or its gold buying clearly speeds up.
An AI correction
The Bank of England warned on 30 September that AI valuations could suffer a sharper sell-off than July’s, and that disappointment over AI productivity could hit technology stocks and government bonds at the same time. AI-related debt issuance reached about $450 billion by early September, double the whole of 2025. A slow deflation would push money out of US assets; a panic would first pull it into the dollar. Direction unknown, impact large.
Midterms and the trade gap
A weaker dollar and cheaper fuel suit any administration before an election, and the goods trade deficit widened to $132.6 billion in August. Part of such gaps can be stockpiling ahead of tariffs, so this light is dimmer than it looks.
Five green, four amber, two red and two grey on 4 October, up from four green on 30 September. More lights now point to a weaker dollar, and still the dollar closed the week higher, at the 50% line. That is the divergence: the data turned, the price did not. Diesel and war are the two red lights left. Until they change, the ship can hold its course against the data; when they do, the rest of the bridge is already set for the turn.
What the history says
Two checks against the record, both calculated from the Federal Reserve’s own dollar indices.
Midterms. In 9 of the 13 midterm years since 1974, the dollar fell between 30 September and election day. The median move is small, about 0.8%, and the strongest cases came in years with a trend already in place: 4.2% in 1990, 3.9% in 1998, 2.5% in 2010. In the month after the vote the dollar rose more often than it fell.
| Window | Dollar lower | Median move |
|---|---|---|
| 30 Sep to election day | 9 of 13 | −0.8% |
| First month after the election | 5 of 13 | +0.7% |
| Six months after | 8 of 13 | −2.8% |
April 2024. The 2-year yield stood at 4.93% on 15 April 2024, almost exactly where it is now. Over the next four to five weeks the Fed’s broad dollar index fell about 1%, then rebounded to a new high by week nine, helped by the French snap election. Mapped onto today, weeks four to five land at the end of October and weeks eight to ten at late November and early December. The difference is the curve: in April 2024 the 10-year yielded less than the 2-year; today it yields 37 basis points more. That is not a bet on the Fed. It is a price for lending to a government long term.
What it means for gold
Gold is priced in dollars, so a dollar sliding from the lid toward the bottom of its box is a tailwind for gold and more so for silver. It has been rising even against the highest real yields in years, a sign that buyers other than yield-chasers, central banks above all, are setting the price.
The fractal carries a warning too. In 2024, point six was the low before a 10% dollar rally. If the pattern repeats, the tailwind could turn into a headwind around the end of the year. A map is only useful if you know where it stops being right: a weekly close above 101.35 would mean the ship is not turning at all, and the flat edge of the cloud near 103 becomes the magnet instead. Update, 4 October: that close came on 2 October, at 101.93. What stands between it and 103 now is the 50% line at 102.0.
Sources
- Federal Reserve via FRED: broad dollar index (DTWEXBGS), major-currency dollar index (DTWEXM, 1973–2019), Treasury yields (DGS2, DGS10, DGS30), 10-year TIPS yield (DFII10). Midterm and April 2024 calculations by the author. Live panel: The Dollar Balance.
- ICE U.S. Dollar Index futures, weekly and 15-minute charts, 30 September 2026 (TradingView, Investing.com).
- U.S. Treasury, “Treasury announces increased sizes of nominal long-end liquidity support buybacks beginning September 9”.
- CNBC, “Bessent moves to curb Treasury yields, putting new pressure on Warsh’s Fed”, 19 August 2026; “Bessent could tap near $1 trillion Treasury General Account to fund bond buybacks”, 24 August 2026.
- INE (Spain), CPI flash estimate, September 2026; investingLive, “French inflation jumps in September as HICP rises to 3.4%”; release figures for Germany, Italy and the US from the ForexFactory calendar, 30 September 2026.
- U.S. Bureau of Labor Statistics, release schedule, October 2026.
- Federal Reserve Bank of Atlanta, GDPNow, estimate of 25 September 2026.
- Bloomberg, “Russia extends diesel-export ban by a month through October”, 30 September 2026; The Moscow Times, “Russia extends diesel export ban until end of October”.
- Bloomberg, chart “Cayman hedge funds buying bills faster than ever before” (Treasury bill holdings, Cayman Islands, to July 2026).
- CNBC, “Japan’s 10-year bond yield hits 30-year high after Treasury sell-off”, 24 September 2026; Asia Times, “Two bond bombs, one fuse: US, Japan hurtling toward a reckoning”, September 2026.
- Bank of England, Financial Policy Committee record, September 2026, as reported by Securities.io and Quartz, 30 September 2026.
- MNI Chicago Business Barometer, September 2026 (58.8; consensus 51.0).
- World Oil, “U.S. to release another 40 MMbbl from reserve as fuel prices surge”, 29 September 2026.
Chart readings, counts and levels are the author’s own. Educational content to support your own research and decisions. Not financial advice.